Folders and Billing
Problem
After delivering cluster-based access controls, Cockroach Labs experienced a significant number of enterprise customers beginning additional product evaluations. While this was great from a business perspective, users were began hitting usability issues around finding the right clusters from within the stacks of clusters that were being created.
At the same time, customers began asking for support in figuring out how much of their CockroachDB allocated usage each of their teams were utilizing. As my team was directly involved with identity issues, we were tapped to handle this dual-pronged challenge.
Solution
We introduced Folders to CockroachDB’s administrative UIs. Folders provided a way for platform engineering functions to help their product engineering colleagues organize their clusters and view aggregate usage per via that team's folders.
Folders for cluster management
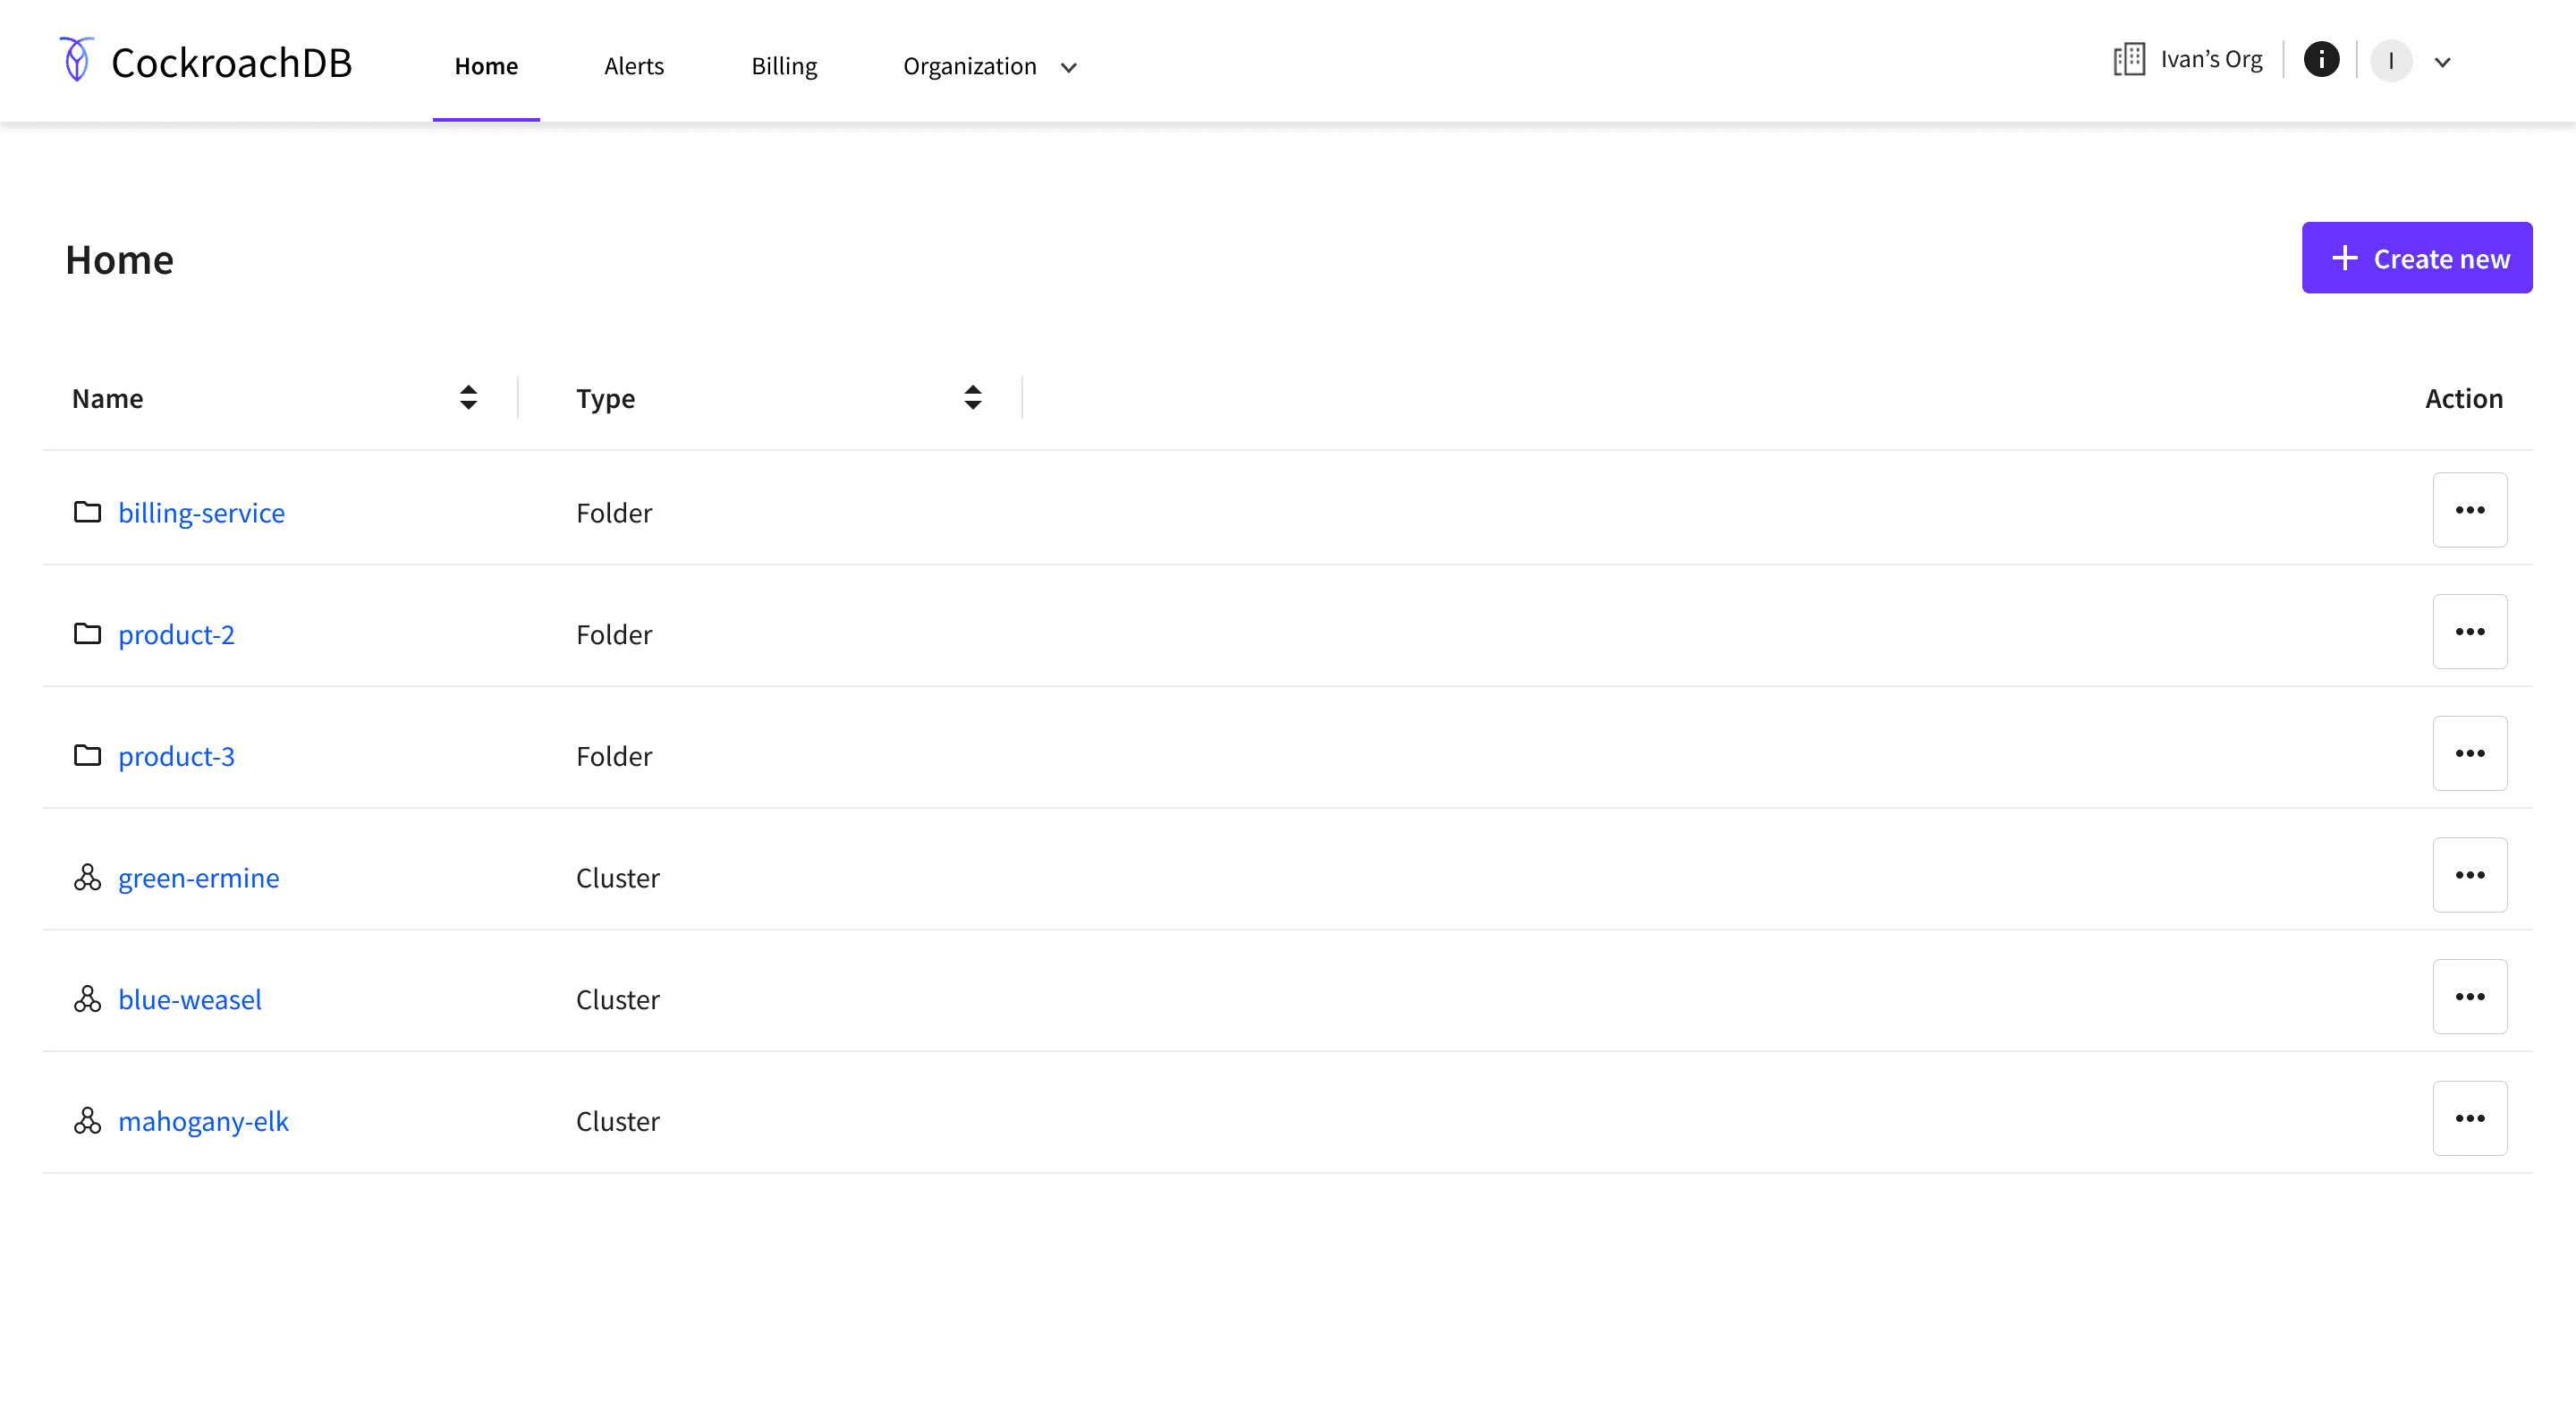
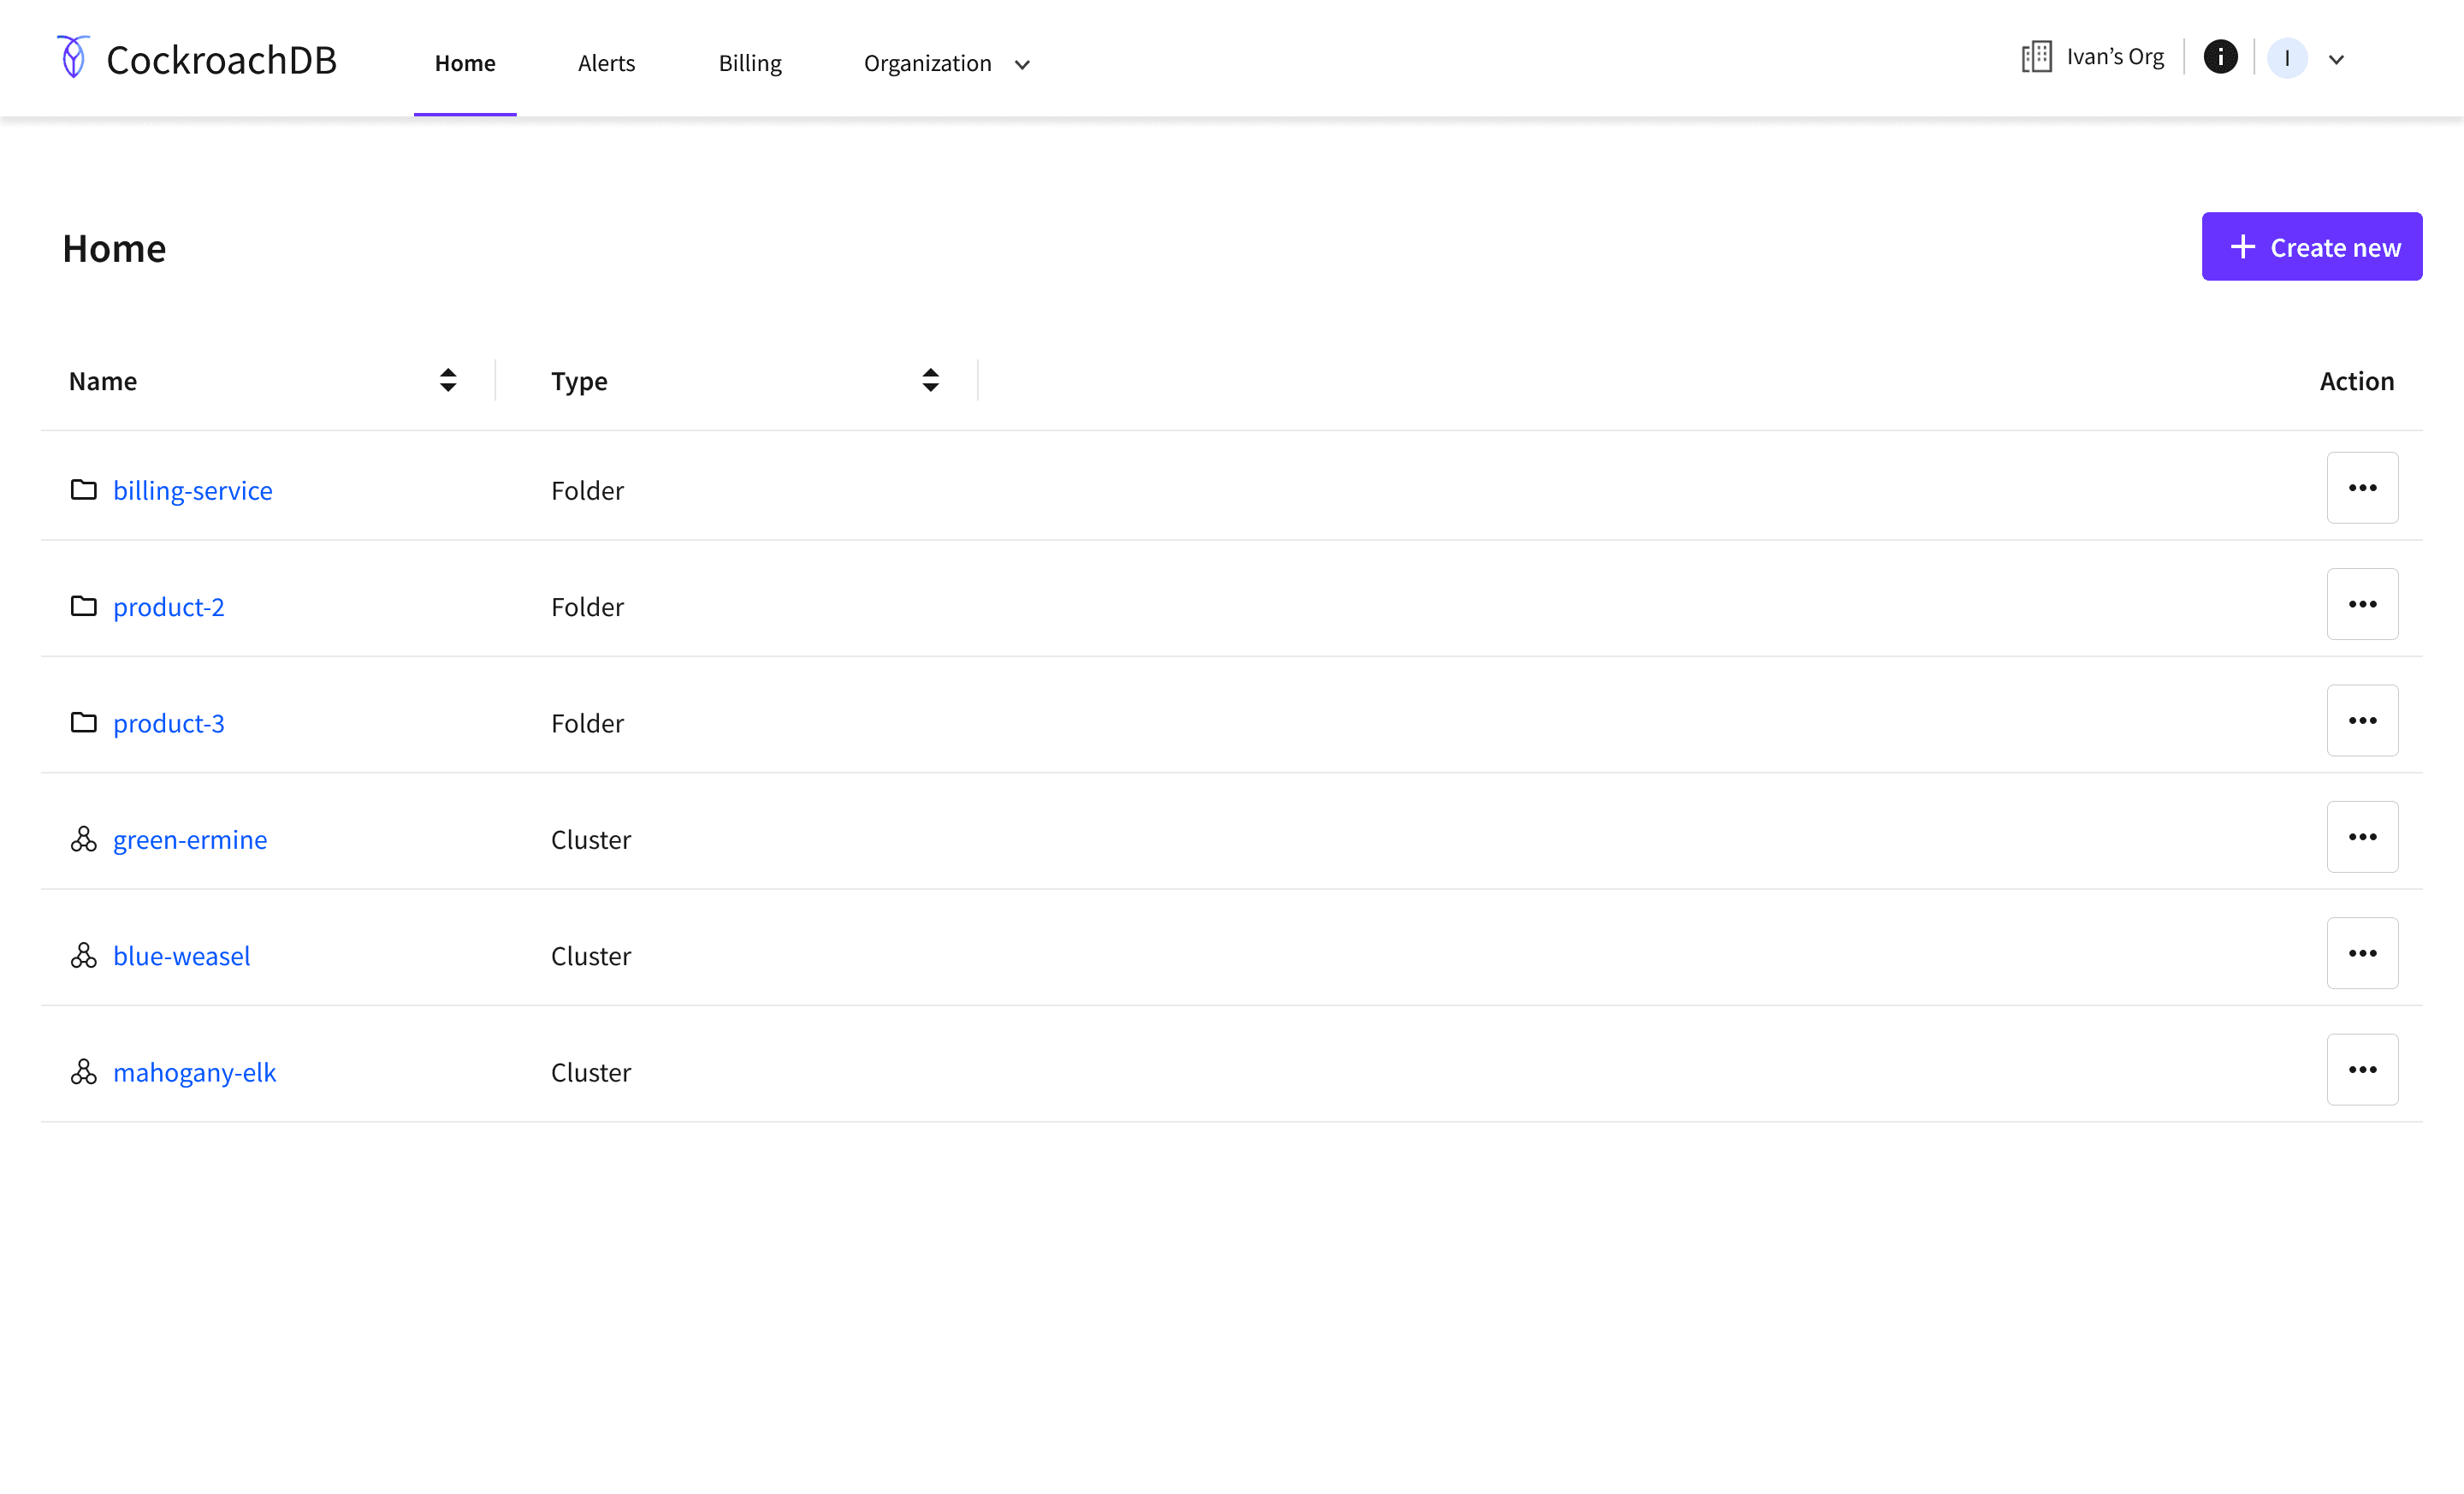
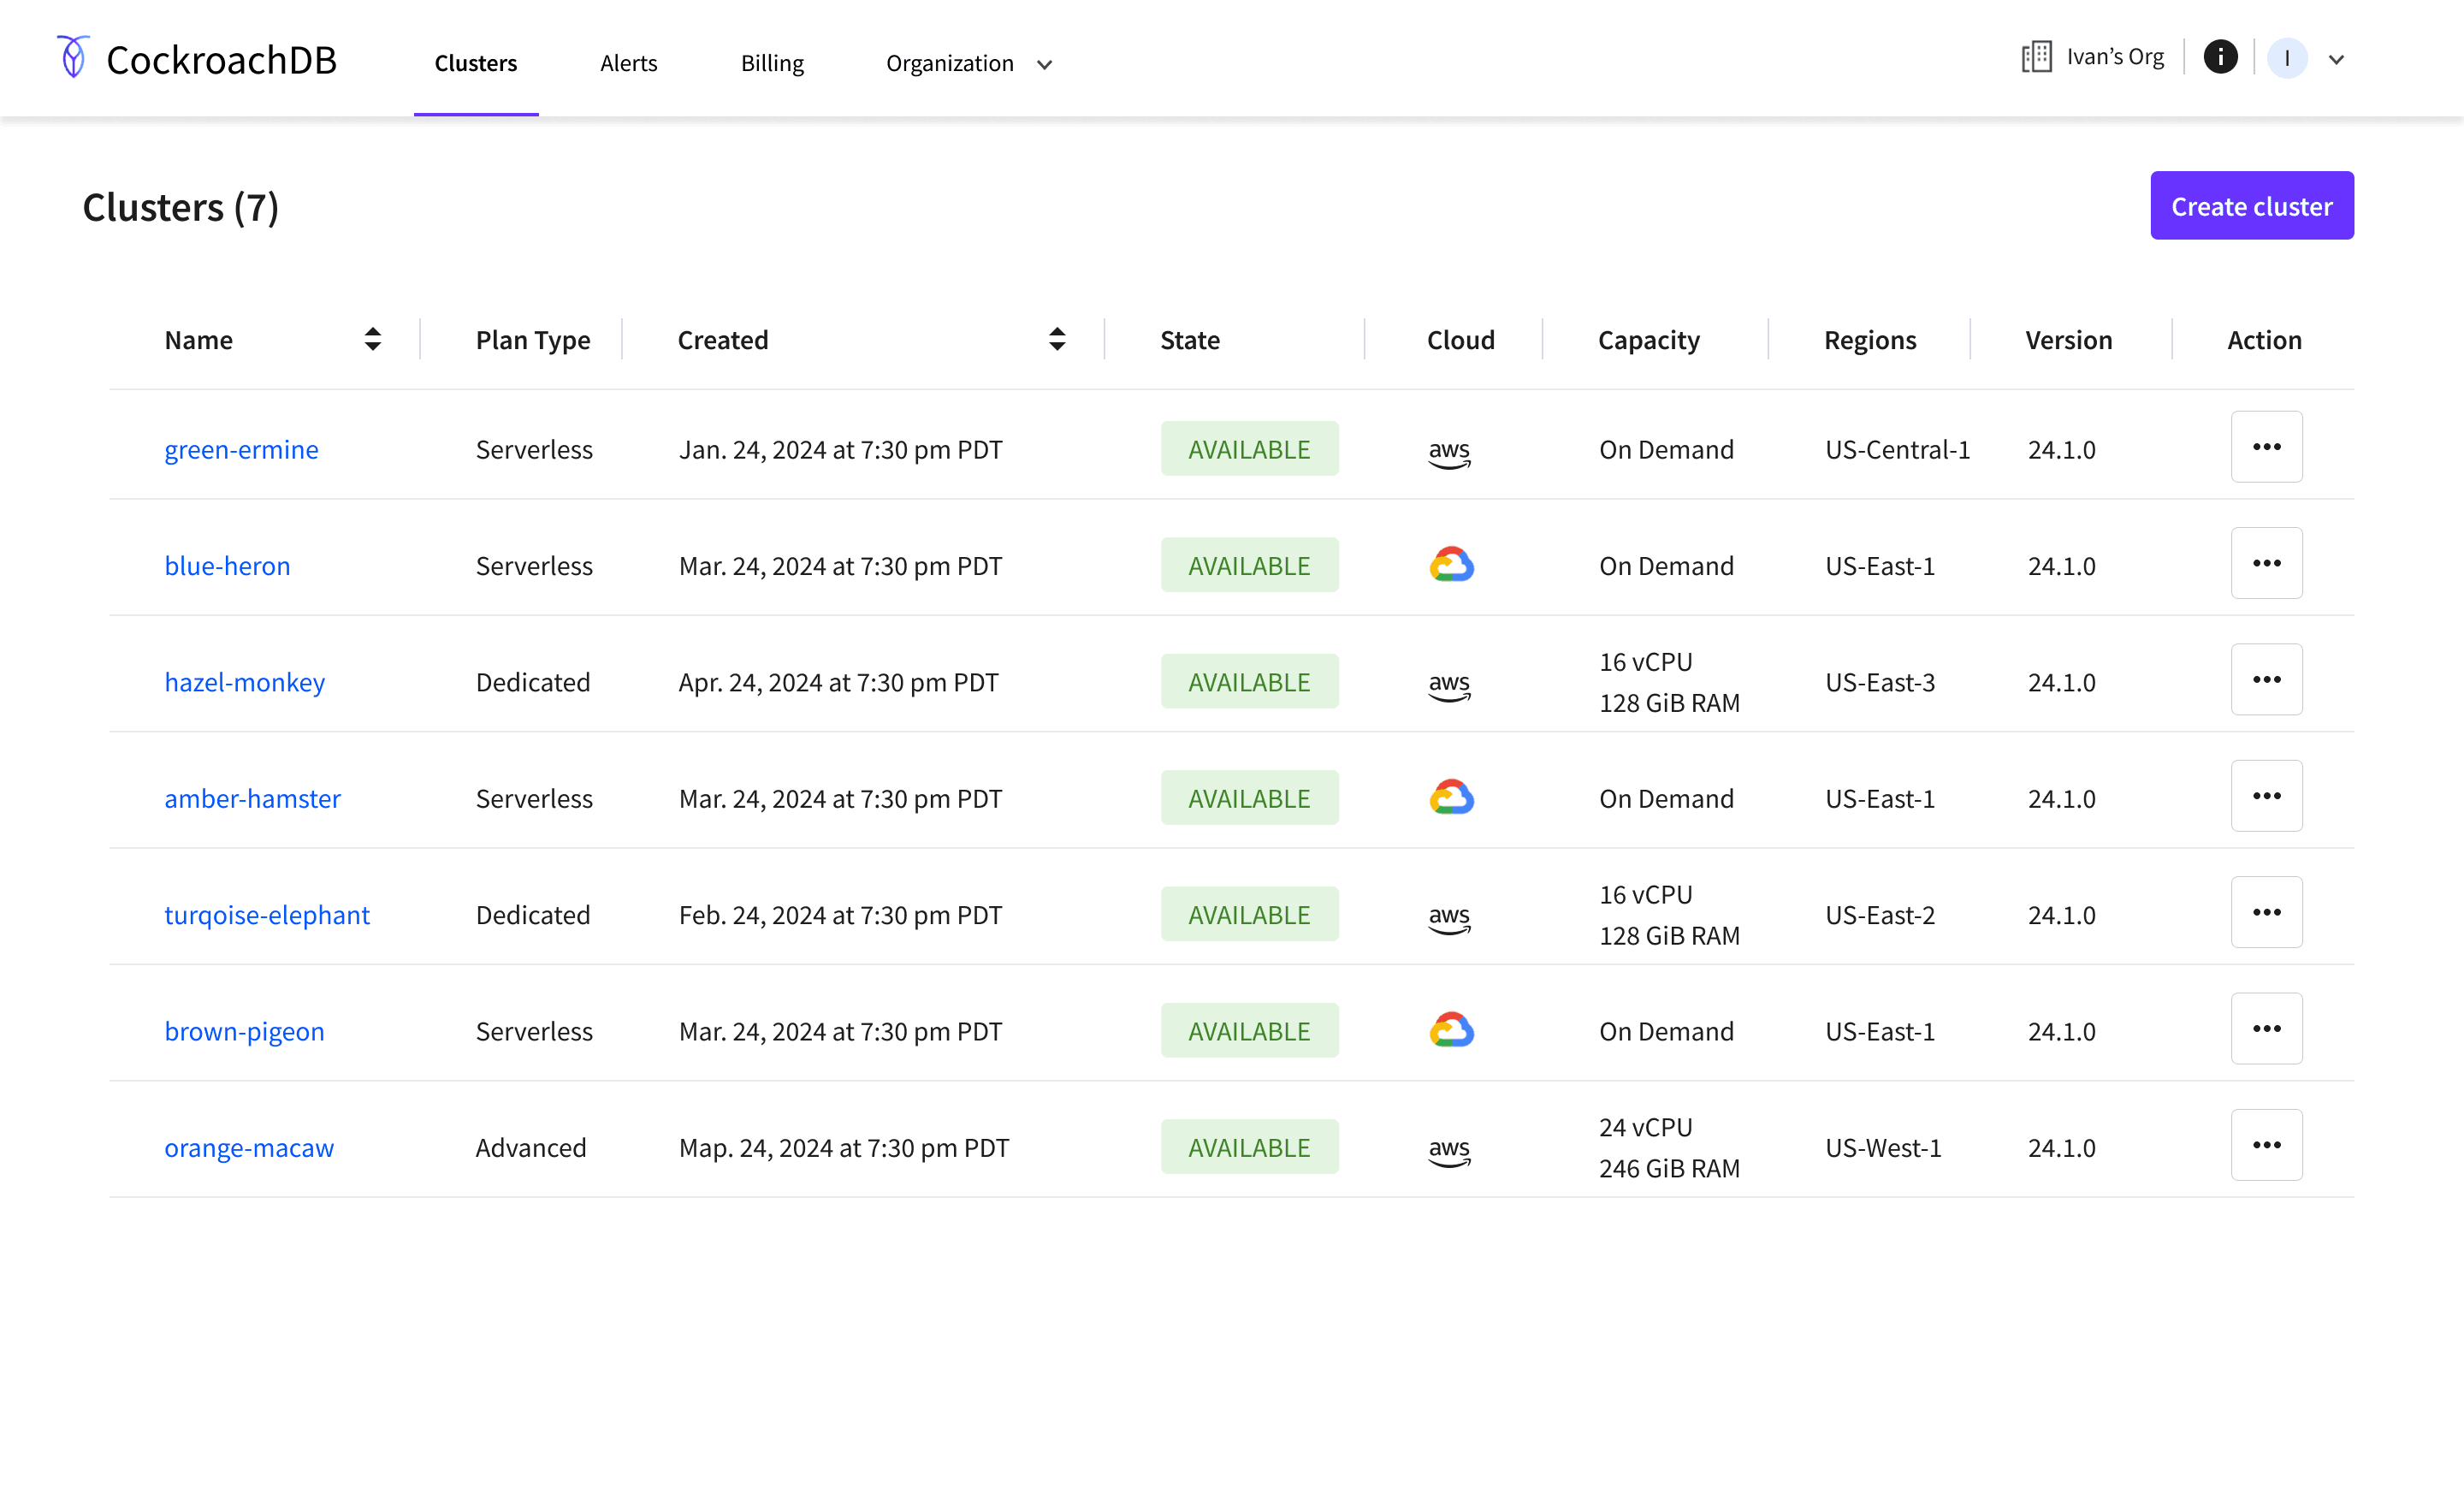
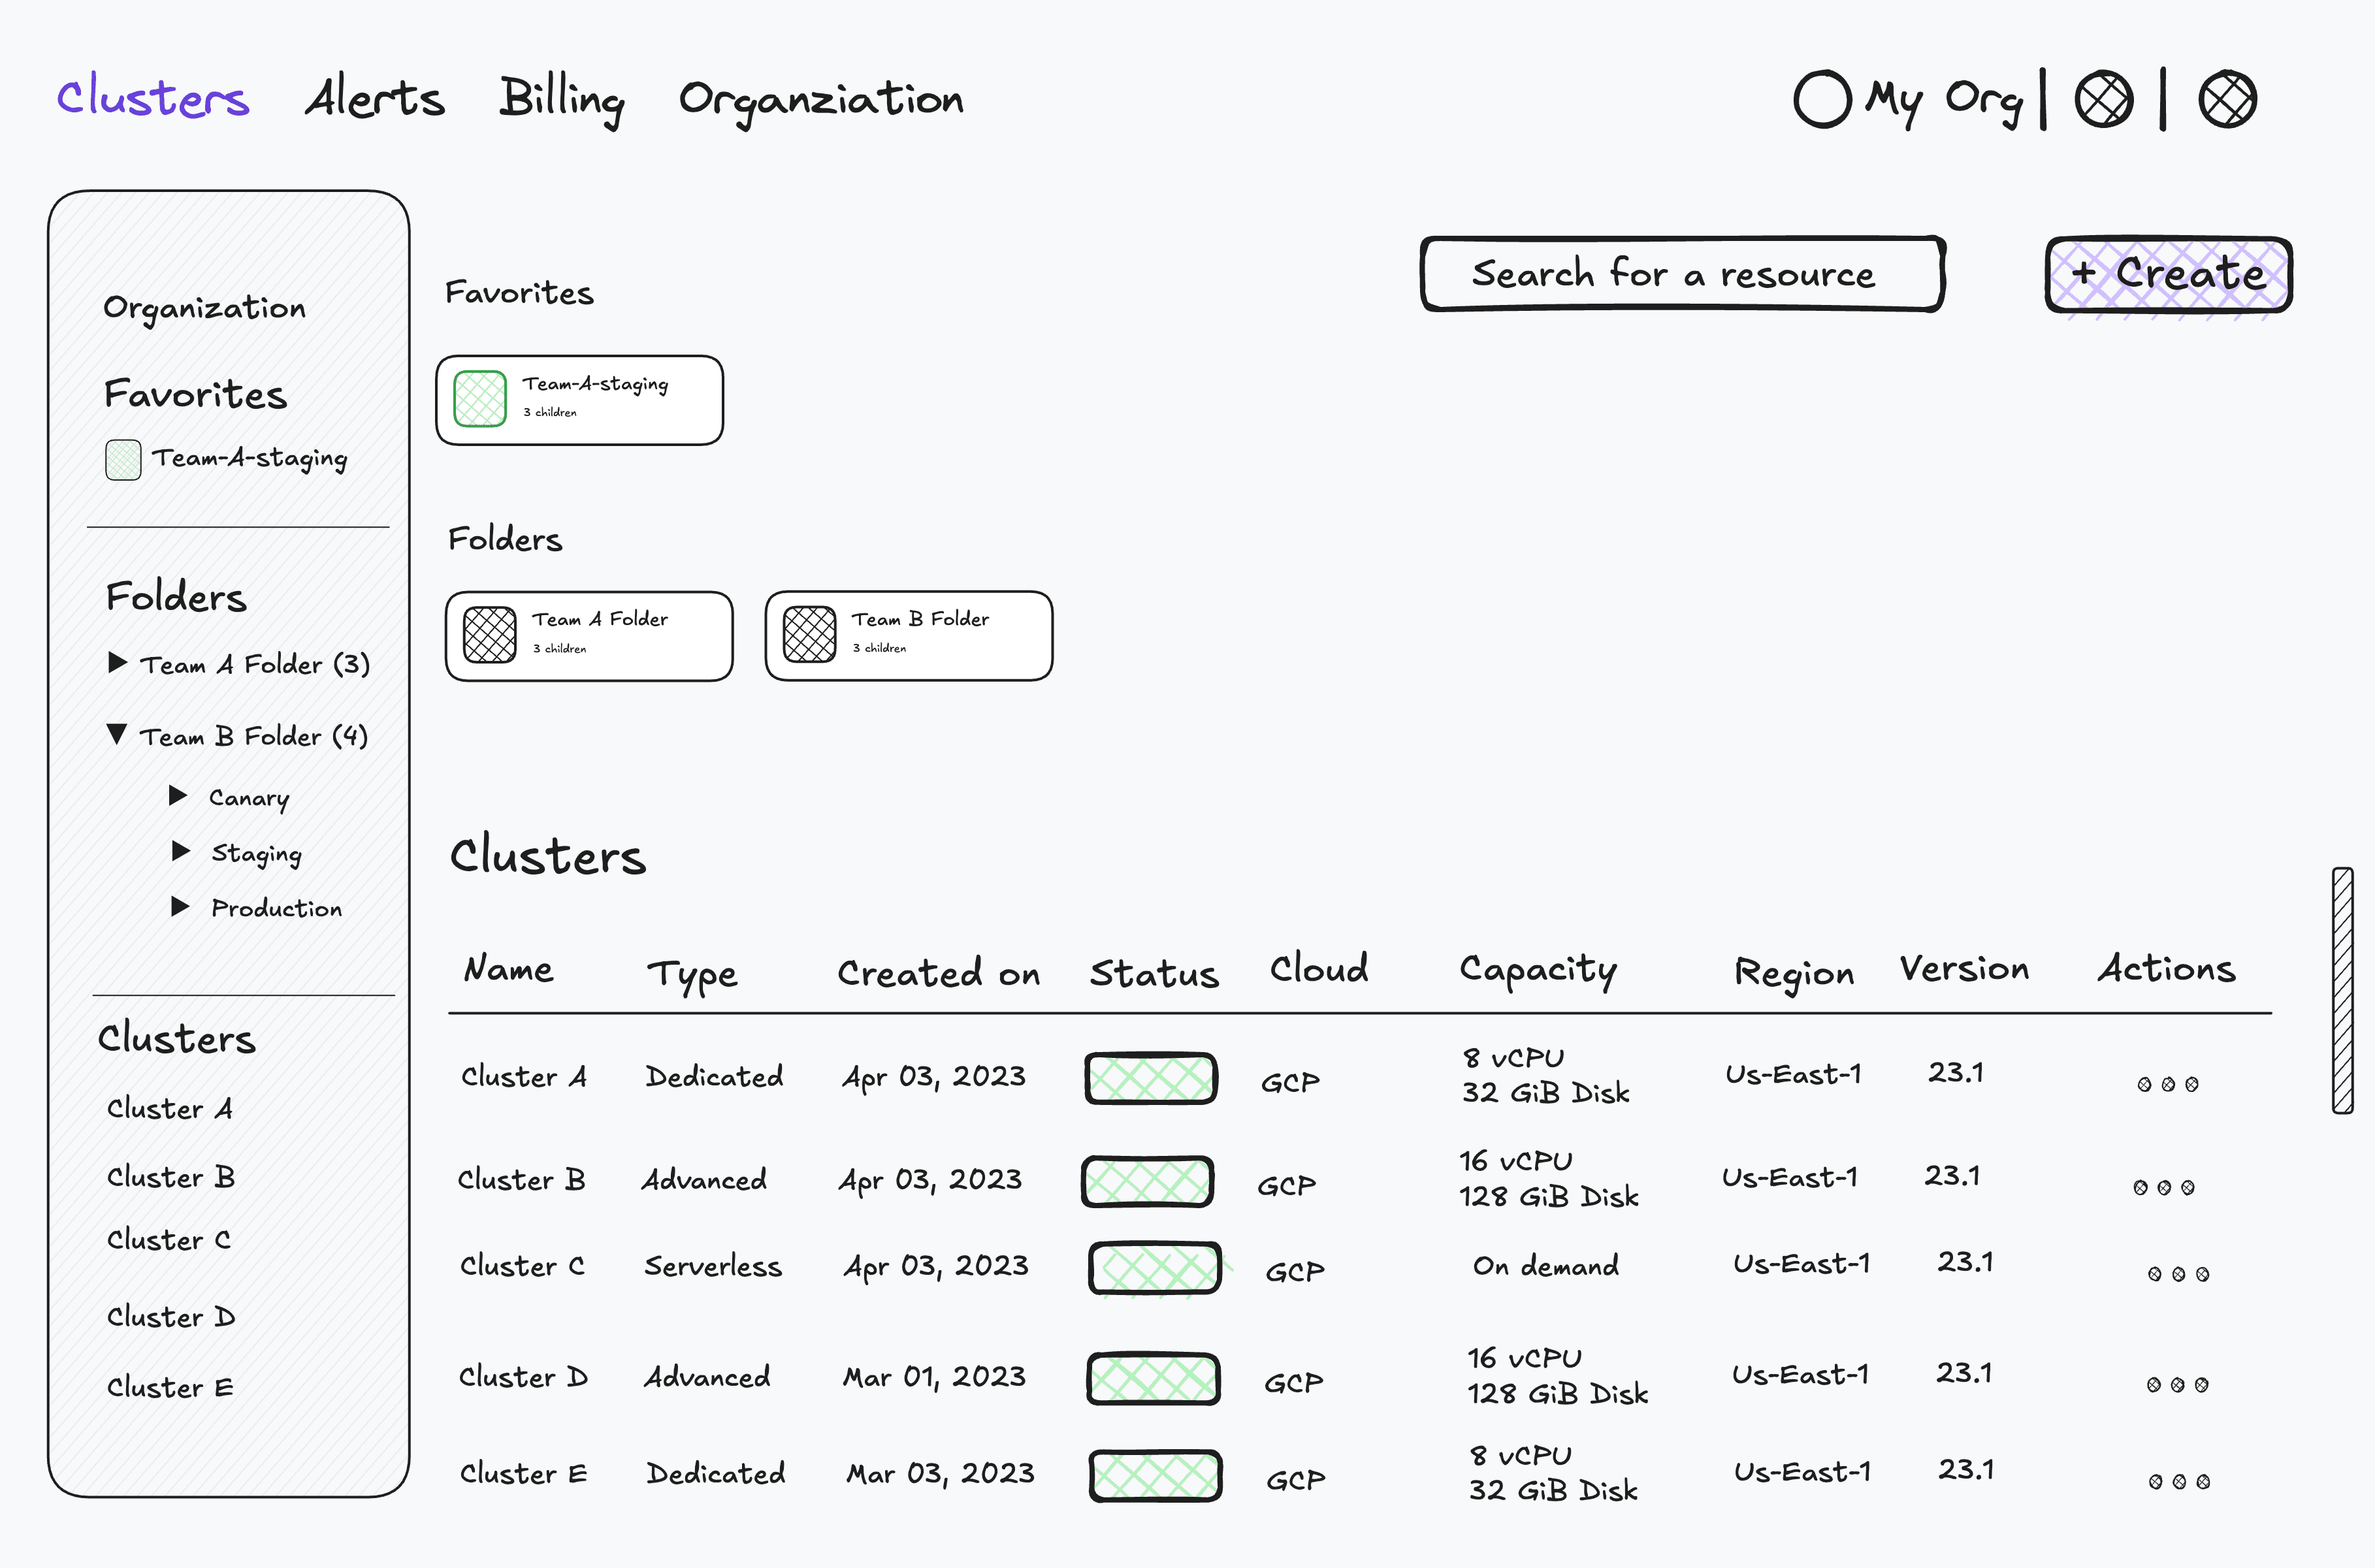
My team and I updated CockroachDB's cluster list view, allowing platform engineering functions to create nested folders to manage clusters by product and/or product engineering team.
View usage by folder
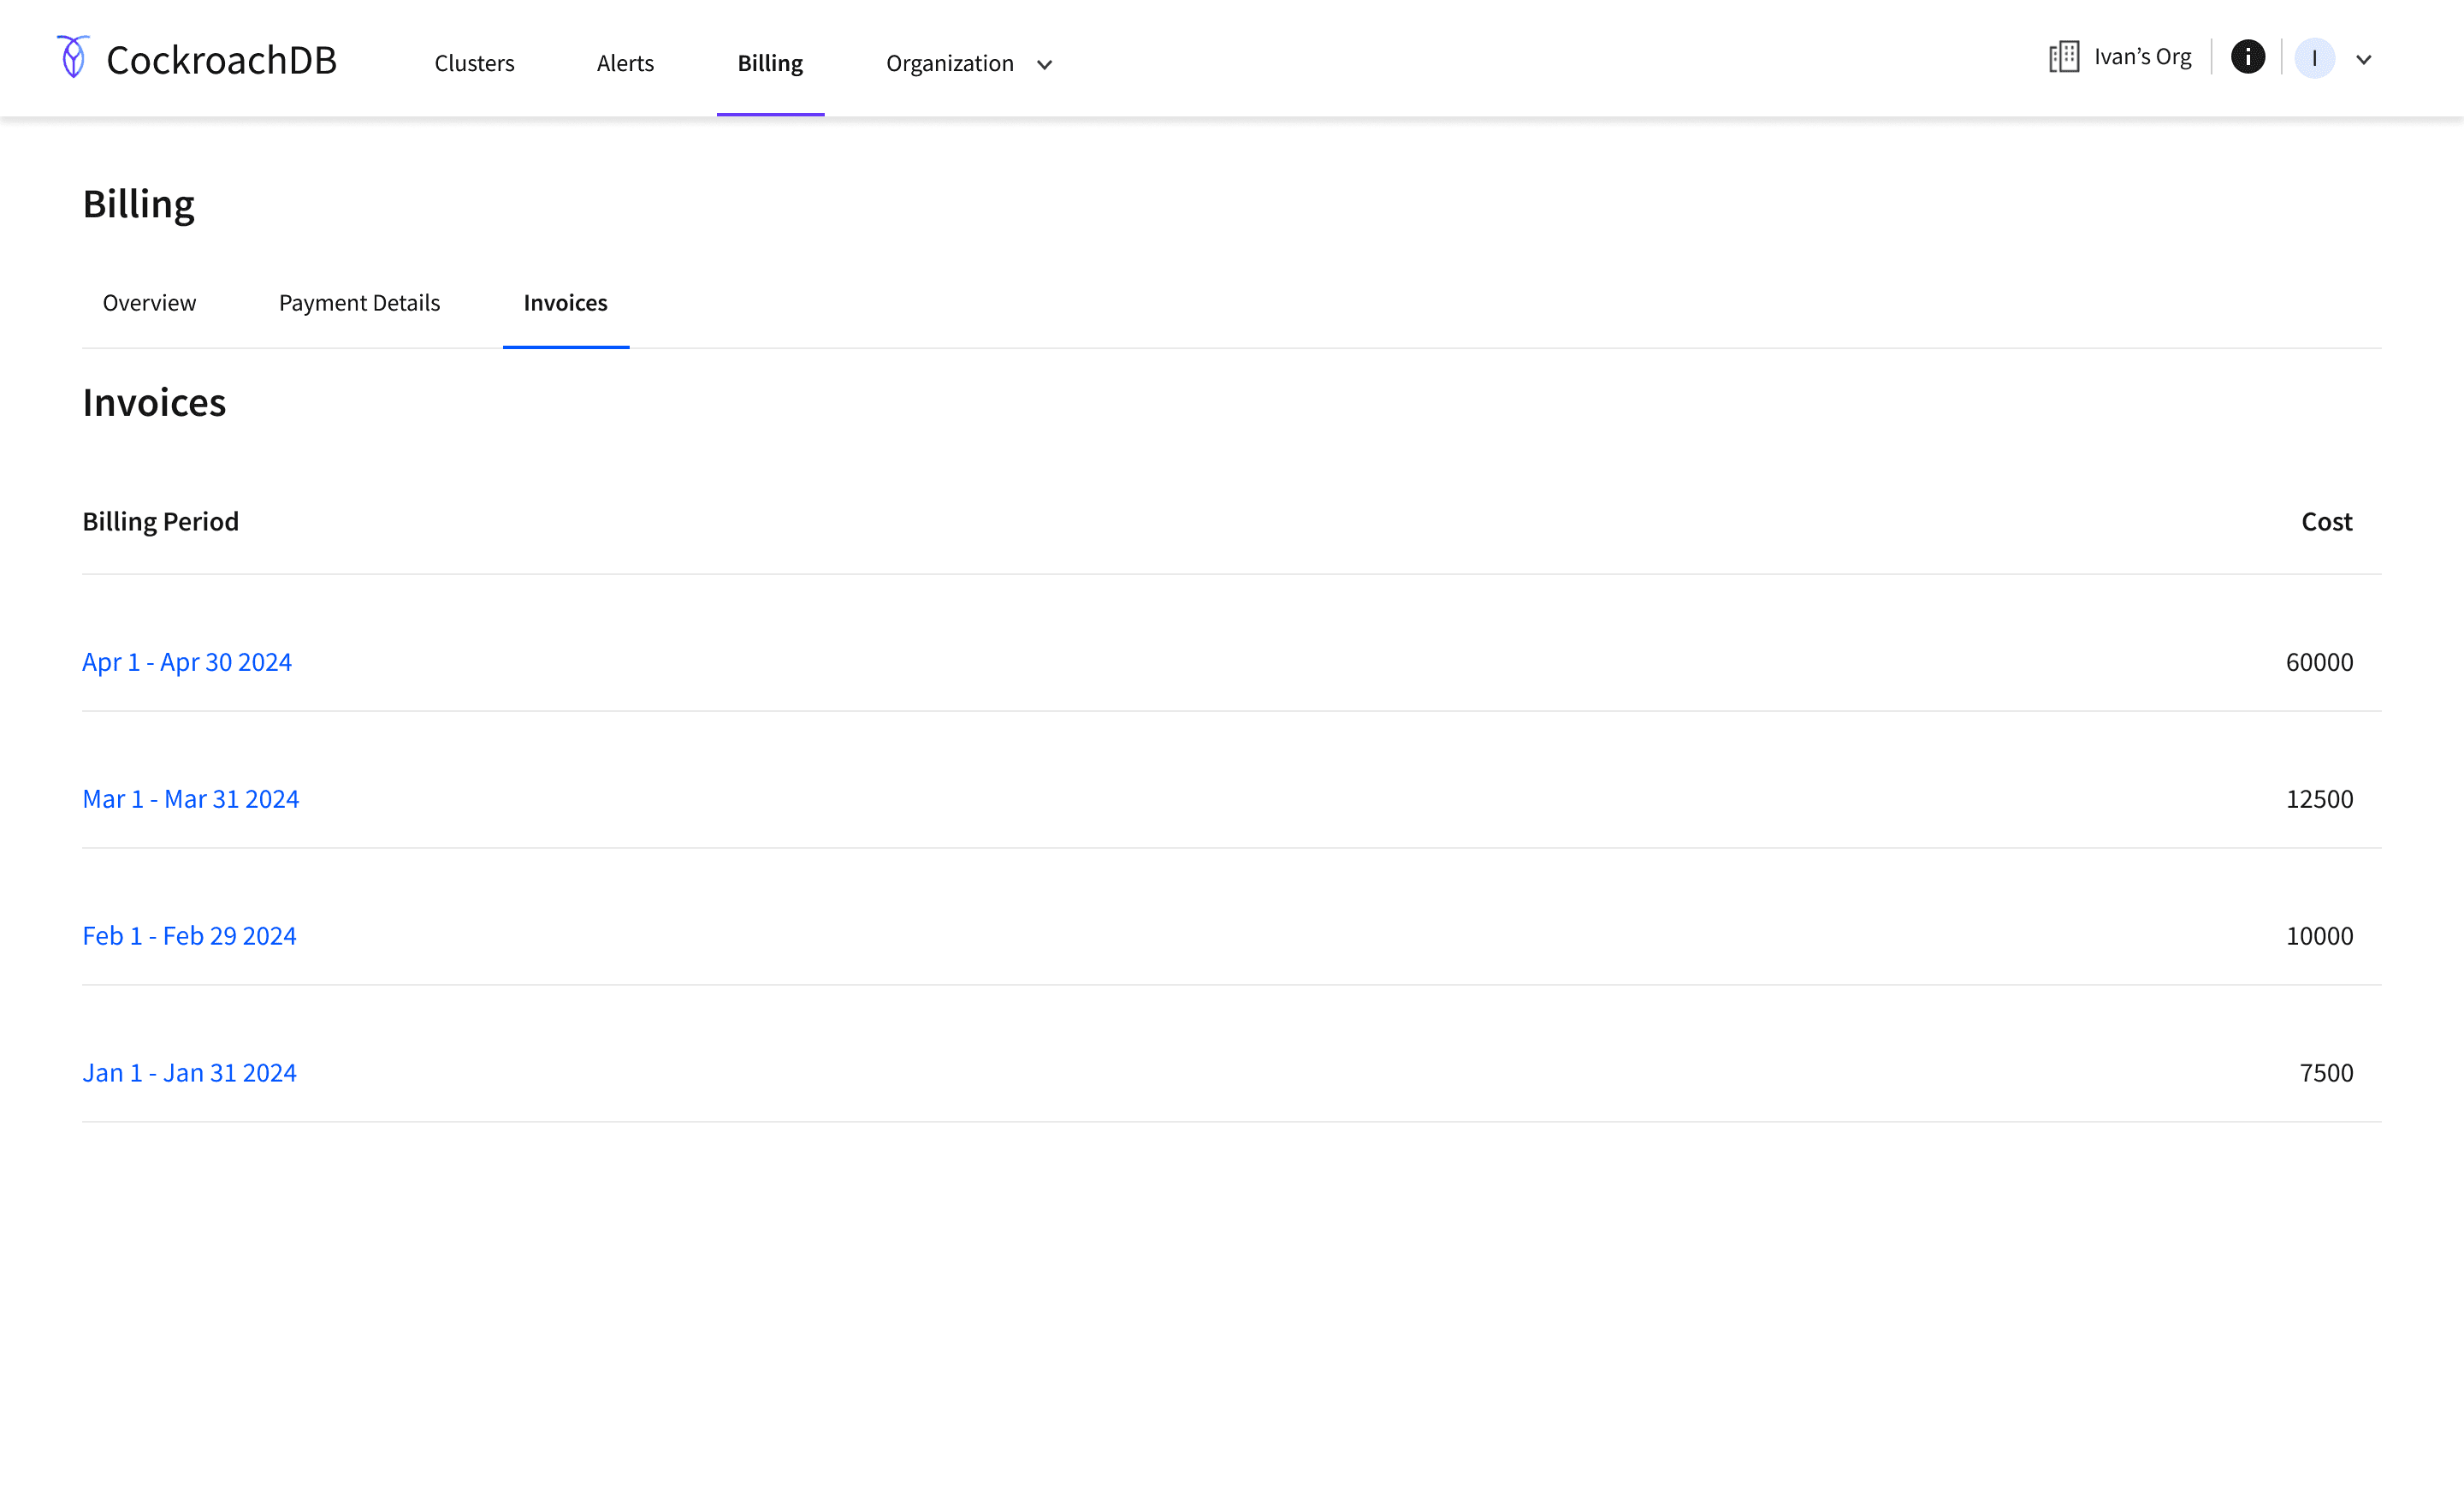
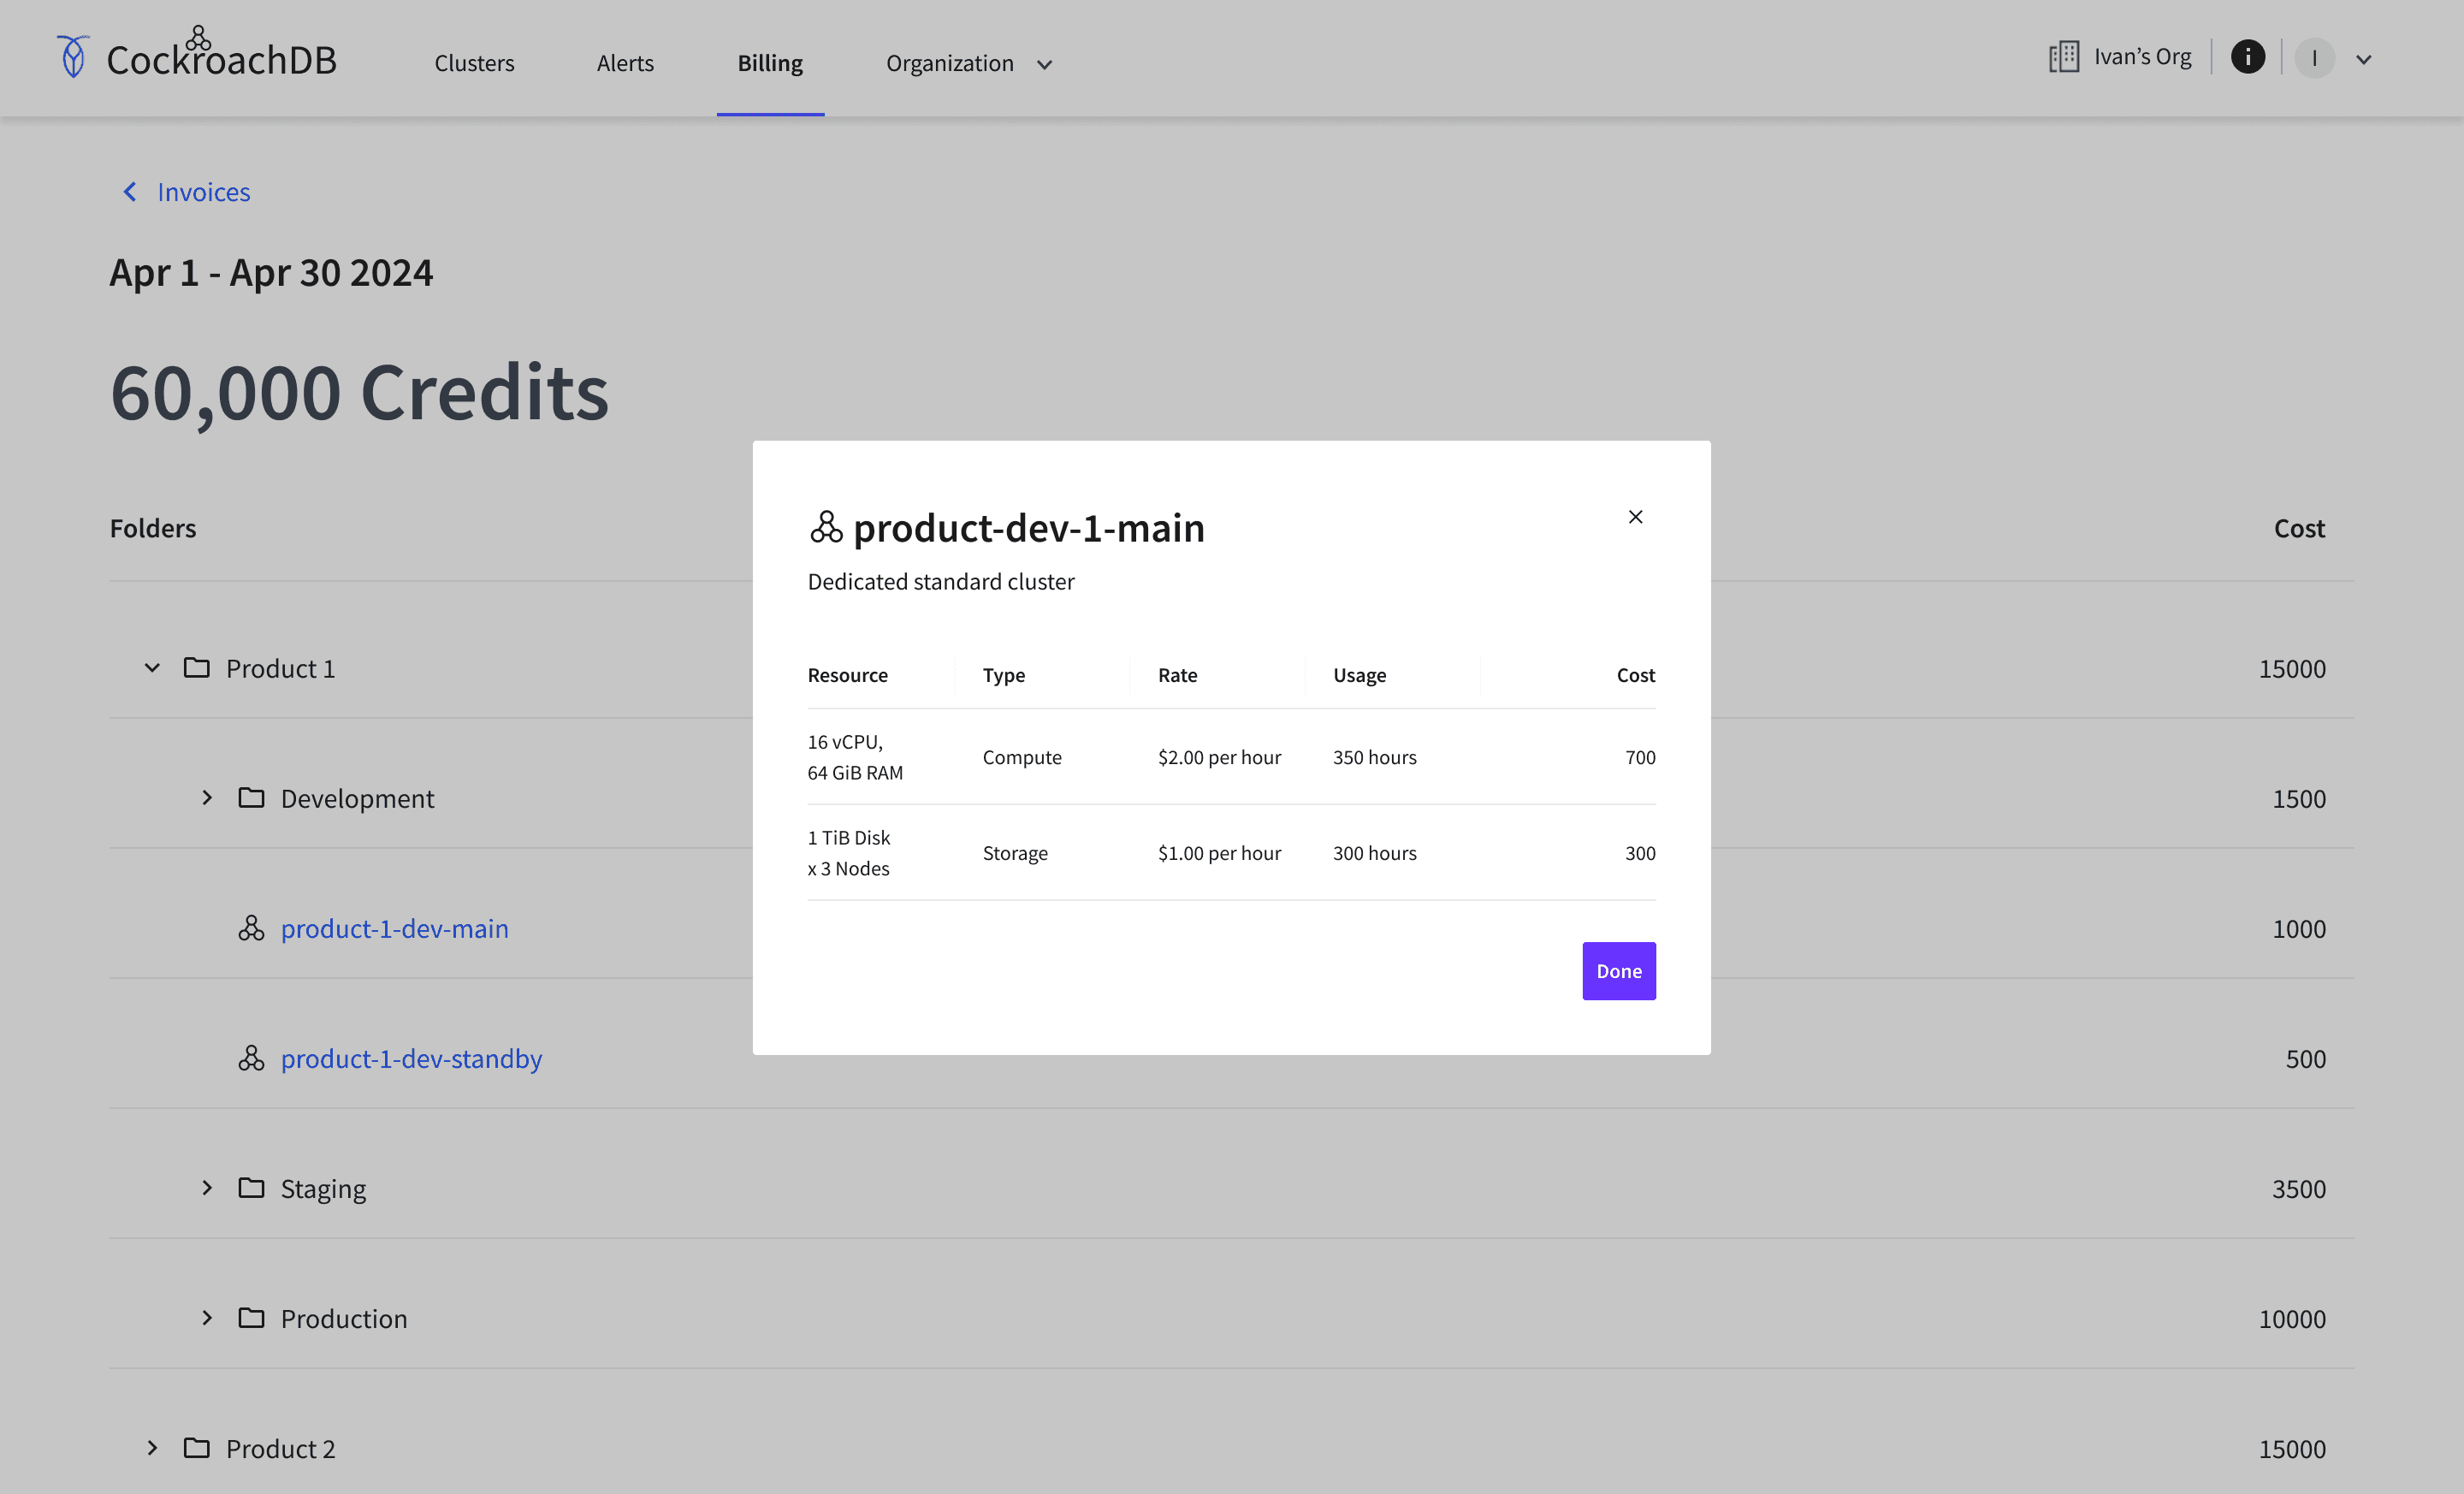
To help engineering and technical leads report on usage by team internally to engineering leadership, we revamped our Invoices UI to show the cumulative usage by Folders.

Impact
10+ enterprise customers created at least 2+ folders that represented two separate teams over the next two months
Anecdotally, tech leads felt a lot more confident walking their leadership through projected CockroachDB usage per team
Insights
As customers began adding more teams to begin migration evaluations, our customer-facing teams reported back that customers were asking for ways to organize clusters. While my team and I had anticipated that cluster-based access controls was just the tip of the iceberg in our efforts to support enterprise customers, we were puzzled by this feedback. Cluster-based access controls should’ve prevented adjacent teams from being able to view another team’s clusters, unless a user was explicitly granted permissions. Curious, we joined several check-in calls with enterprise customers.
Platform engineering function
Enterprise customers typically had a platform engineering function. Whether this was a dedicated team for platform engineering or a product engineering team that first migrated their service to CockroachDB, these teams would oversee 3rd-party tooling like CockroachDB on behalf of other product engineering teams.
It was confusing to rely on just the name of the cluster shown in the UIs, so they were looking for a better way to organize clusters belonging to different teams.
Usage per-team conversations
We also learned that the leads of these platform engineering functions regularly briefed their leadership on CockroachDB usage and cost. Leadership, it turned out, was very keen on keeping costs manageable.
While the first priority would always be migrating and evaluating a workload on CockroachDB from a performance perspective, cost couldn’t be ignored in the long term.
The leads we spoke to said that they were responsible for reporting usage for each team experimenting with CockroachDB, but the billing interfaces we had required them to aggregate usage per team outside of our product, giving off a sense of immaturity for something presenting as an enterprise-grade product.
Folder-like usage
In joining check-in calls with some enterprise customers, we learned that some customers utilized multiple organizations as a way to organize cluster. Most commonly, an enterprise customer would have two separate CockroachDB organizations for their production v.s. non-production clusters.
These customers shared that they were trying emulate folder or project-like organization capabilities they found in other infrastructure products. Customers would setup folders or projects when needed, provision resources (i.e. clusters), and then grant access to the colleagues in charge of an evaluation.
Managing teams via folders
Navigation
While the concept of Folders made sense, I quickly realized that introducing Folders into our product experience was a dramatic change. While cluster-based access controls had introduced a pseudo-ability for customers to control the visibility of clusters by explicitly granting access to a team, fundamentally clusters existed in a “flat” structure within an organization.

From a usability perspective, nesting folders and clusters within folders, could introduce navigational complexity that would increase as more folders were created. As we didn’t have a good sense of how deeply our customers might nest folders, I reached out to my customer-facing colleagues to understand what we were up against
Diagraming out 30+ customers existing and future use cases, I found that for the most complex customer use cases, nesting would at max, go about three layers deep. Customers would likely have a folder per product or product team, and then folders below that level for the development environments for each cluster. With customers who had critical regions to manage, a third layer of folders might be used to contain a regional cluster.
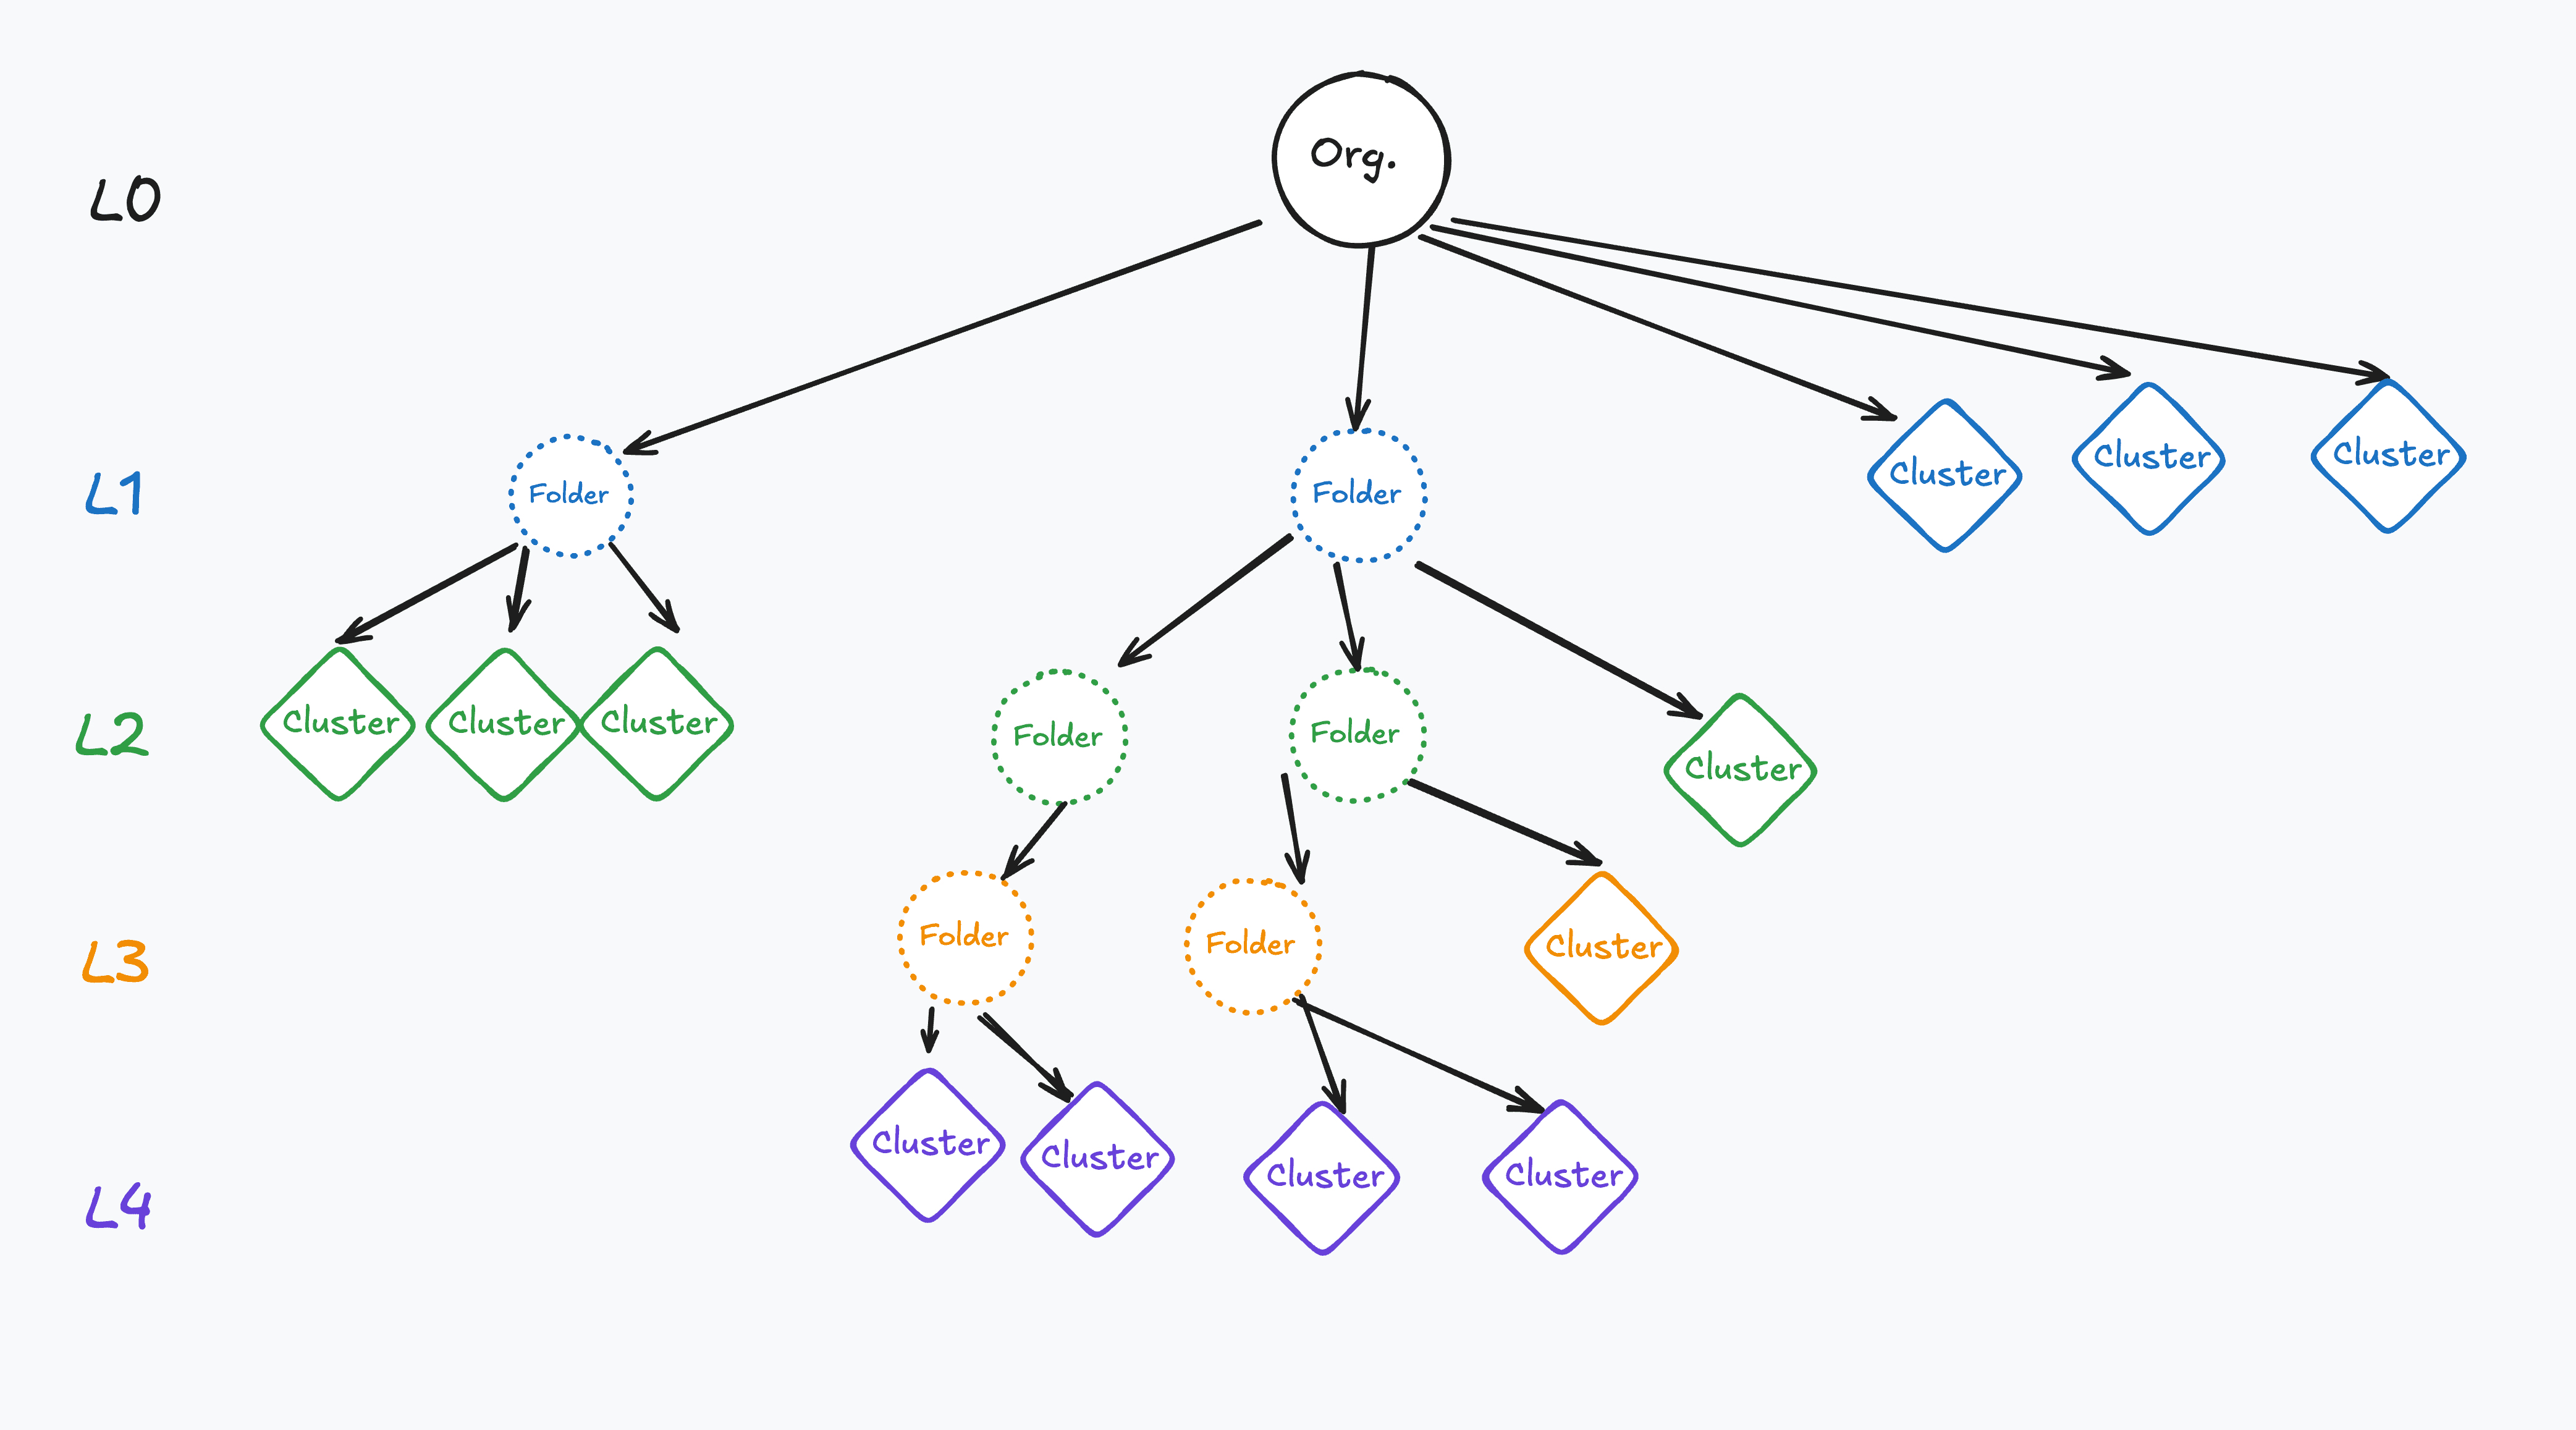
While there was always a chance that customer would need additional complexity, these customer folder diagrams provided us with enough confidence that allowing 3 total layers of nesting for folders would be sufficient for even the most complex customers.

Findability
With more clarity around how customers may structure their folders, I turned my attention to how our interfaces may change as result of folders. Put simply, my main concern was how folders would be displayed alongside clusters. Furthermore, I suspected that additional navigation utilities might be needed at some point to help users find their clusters, especially if those clusters were deeply nested.
Through a series of open ended mini-interviews with both customers and colleagues, I noticed that several affordances kept on coming up including search, the ability to favorite a resource, and tree-like navigation utilities.
While these mini interviews provided glimpses into how our UI may evolve to support enterprise customers at scale, I kept in mind that these additional features required more investment. Customers had mentioned during our chats that until they reached double or triple digits of clusters, these features would be nice, but not must haves.
I added these additional navigational features to the project backlog. If we were successful with delivering Folders, I knew that we'd need to reach for these designs in the future.
Final designs


Displaying usage by team
While navigating the experience updates introduced by folders, I also had to stay close on how we'd need to update our billing experience. We knew that we had to equip our customers' tech leads with the knowledge of how much CockroachDB credit each of their product engineering teams was consuming. The question was how?
Usage per team, over time, within the product
During our customer interviews, customers shared that when they received a invoice email from Cockroach, they would make time to check the statement's details. They would then group usage by clusters belonging to individual teams, often in a spreadsheet or their personal notes, and then compare that billing period against the preceding two or three billing cycles.
By comparing usage over time, tech leads developed a rough sense about the consumption trend per team and, most importantly, whether that consumption trend was on target with their expectations. Over time, tech leads developed an internal sense of when usage seemed 'off', and would follow up with teams as necessary to investigate and understand why.

Tech leads, while understanding, were not shy in pointing to charts in our observability features. If they could view credit usage per team over time visualized in a chart, this would be incredibly helpful.
Curious, I followed this lead and suggest that we should do a research spike on whether the ground work laid by our observability colleagues could be repurposed for this project.
Infrastructure wrangling
Investigation into our implementation of our billing infrastructure, however, made my team and I realized that to deliver a chart-based experience would require a significant investment.
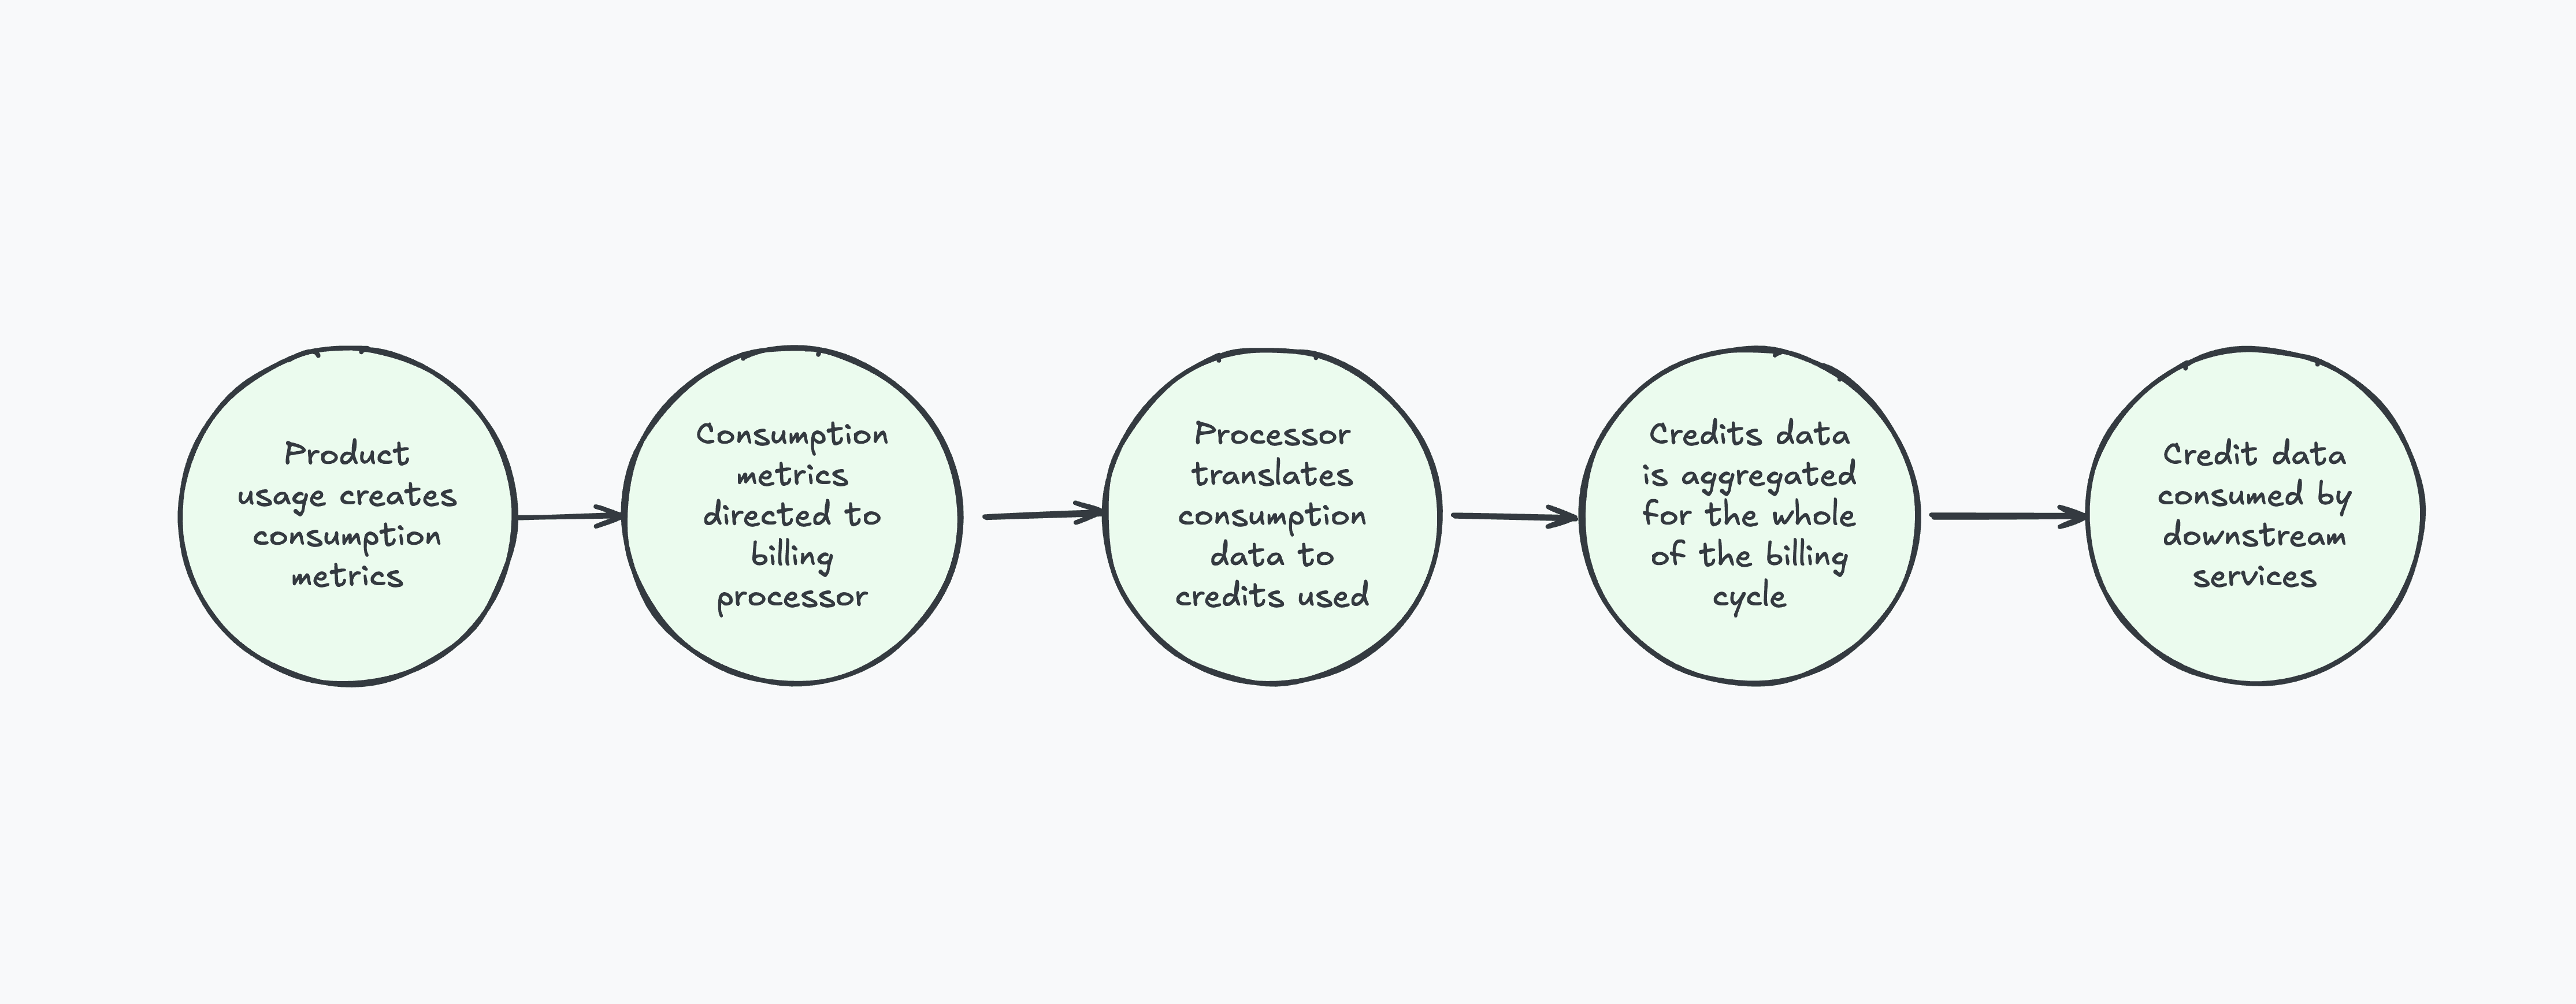
As CockroachDB's cloud product matured, we had enlisted the help of billing infrastructure product that handled all of our usage calculations. At a high level, this service took raw usage metrics like compute and storage consumption and reconciled with billing metrics, performing the calculations to accurately represnt usage as credits. The reconciled credits data would then be sent downstream to systems that powered customer invoicing, business intelligence, and CRM systems.
But though we had scoped out work to aggregate the credits usage data and make the aggregated credits data available to our billing UIs, giving customers the ability to view trends over time and visualize them via a chart raised concerns around accuracy of the data displayed to users and that charts would take an unacceptably long time to load.
Considering accuracy and load times, while the core functionality of Folders was still being built, and dependency of business-critical downstream systems, we knew that we had to find more fault-tolerant options.
Working backwards
Acknowledging the constraints discovered by this research spike, my team and I began searching for a path that would allow us to deliver incrementally against this vision.
As we had already scoped out work to make the aggregated credits data available to our billing UIs, without additional work on our billing infrastructure to account for folders, the highest leverage option available was to figure out how we could display the aggregated credits data in helpful way to tech leads.
Returning to our interview notes, I remembered how customers had shared that the monthly billing statement was the basis for their per team credit attribution. The static nature of these statements made me suspect that there was a potential solution for showing usage by team here.
Parent-child tree structures
As we had utilized a drill-down pattern for folders navigation that was welcomed by tech leads, I had initially thought that we could utilize the same pattern to display aggregated usage by folders. Not only was the pattern vetted by through user tests, it would also reinforce the mental model with new folder management UIs.
But tech leads were less enthusiastic. They had come to rely on the statement page's ability to expand and collapse rows, representing clusters, to view usage. Unlike the folder management UIs, which had no precedent, tech leads already had a mental model of the invoice statement page. Changing the existing interactions from collapsible rows to a drill-down pattern through pages was unhelpfully disruptive.

Comparing the existing invoice statement view to the patterns I had explored, the pattern that came closest were parent-child tree structures.
Though we had originally intended to introduce tree structures as a fast-follow, I saw an opportunity to experiment with that pattern. If this proved successful, it would be additional evidence that the pattern would be used more extensively.